

Career and leadership · Chapter 2
Metrics and KPIs for Presales
Which metrics show whether a presales team works well: core, advanced, client-centric, collaboration and efficiency KPIs.
Why is it important?
Metrics in presales guide strategy, track improvement and align teams with company goals. With them you allocate resources, make informed decisions and look ahead. Your decisions then rest on data instead of gut feeling. Metrics also show how clients behave and what they prefer, so you can plan targeted initiatives. They are a fair basis for assessing performance and accountability in the presales team. Metrics expose bottlenecks. They make successes and problems visible, which lifts team morale. And they help you show stakeholders what the presales team is worth. That keeps the team on today's goals and ready for what comes next.
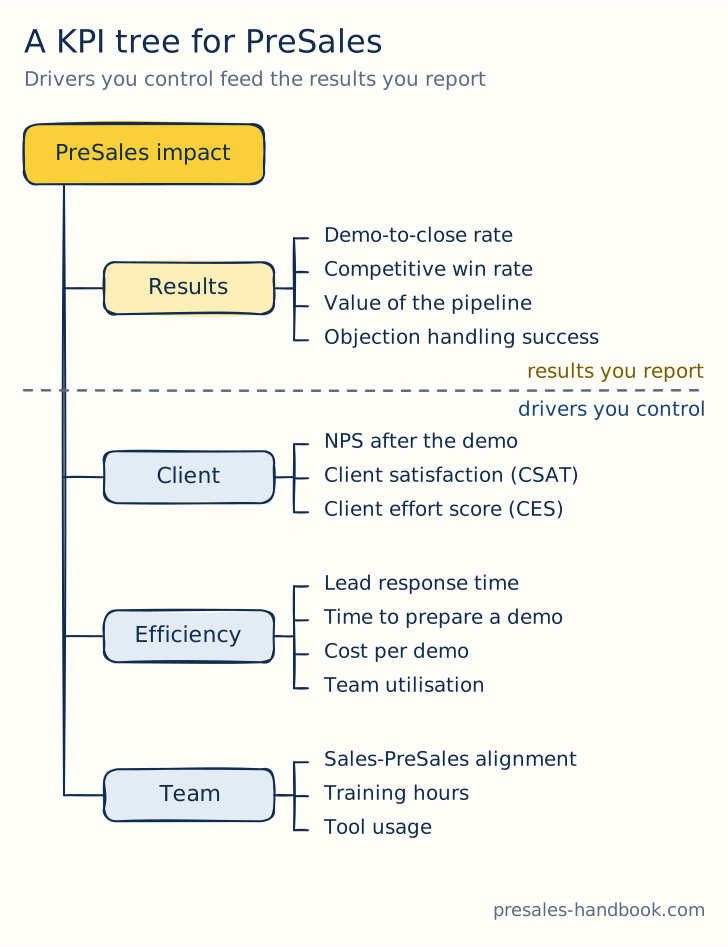
Track the drivers you control. They feed the results you report.
Core Metrics
You can track many metrics. These are the ones that show how well presales works:
Demo-to-Close Rate: The ratio of demos held to deals won. It shows how well your demo works and how it lands with potential clients.
Time Spent on Demos: The average length of your demos. Very long demos point to inefficiency. Very short ones may skip important points.
Number of Demos Conducted: A high number can mean strong interest. It can also mean your qualification is too loose.
Lead Response Time: How quickly does the presales team respond to new leads? Speed often ties directly to the conversion rate.
Client Feedback Scores: Post-demo surveys and other feedback channels show the quality of your demos. They also show where to improve.
Value of the Sales Pipeline: The total potential revenue from all open presales opportunities. It helps you estimate the return on investment (opens in a new tab) and allocate resources.
PreSales Team Utilisation: The share of time the presales team spends on core work, compared with admin and other side tasks. It points to inefficiencies and to processes you can improve.
PreSales Touchpoints: The number of contacts with a lead before it converts or drops out. Use it to tune the presales process.
Follow-up Effectiveness: How often a follow-up moves the lead further down the sales funnel. It tells you how good your communication and timing are.
Advanced Metrics
For a closer look:
Customisation Requests: How often clients ask for a demo built around their own needs or scenarios. A high number suggests your demos are too generic, or the product needs work.
Technical Issue Count During Demos: The number of technical glitches during demos. It shows how robust the solution is and how well the team prepared.
Frequency of Follow-up Questions: If clients often ask questions after the demo, the presentation may have lacked clarity or depth.
Competitive Win Rate: How often you win deals against specific competitors. It shows where your products stand in the market and how well your sales approach works.
Rate of Objection Handling (opens in a new tab) Success: How well the presales team overcomes objections. This one matters because presales often answers the technical and product objections.
Client-centric Metrics
Net Promoter Score (NPS): NPS is usually a post-sales metric. You can still ask after a demo how likely a prospect is to recommend your product. The answer shows how they experienced you and how serious their purchase intent is.
Client Satisfaction (CSAT): Ask how satisfied the client is right after a demo or a meeting.
Client Effort Score (CES): Measures how easily clients get their questions answered or their issues resolved during the presales process.
Collaboration and Internal Metrics
Sales-PreSales Alignment: Tracks how often the sales and presales teams meet, work together or share information. Regular alignment often goes with higher success rates.
Training and Development Hours: The hours the presales team spends on training, upskilling and product knowledge. It shows how the team grows and adapts to market changes.
Tool and Software Utilisation Rates: Measure how often and how well the presales team uses specific tools. That helps you judge the ROI of each tool.
Efficiency Metrics
Cost Per Demo: Add up all costs of a demo. That includes tool costs, staff time and other expenses.
Demos Per PreSales Rep: Track how many demos each presales rep runs. It shows how the workload is spread and how each person performs.
Time to Prepare: The average time it takes to prepare a demo. Efficient preparation often leads to better demos.
From the blog
- 8 min read
Should You Answer an RFI When the Prospect Goes Silent?
You answered an RFI and heard nothing back. Whether to keep responding to silent prospects, and how to qualify before you invest.
Read more - 6 min read
Missed Your Yearly Quota? Here's How to Bounce Back and Overachieve Next Year
Missed your quota? A step-by-step way to reflect honestly, reset your mindset, revise your goals and plan a stronger year.
Read more - 7 min read
Lessons from the Samurai – Applying Samurai Wisdom to PreSales Mastery
Samurai principles for presales: disciplined preparation, the courage to disqualify, integrity in every deal, focus and adaptability.
Read more
In the course
- Technical Functional Qualification (FTQ)Members only
- Opportunity Review Call (ORC)Members only
- Selling JourneyMembers only